
Today’s graph is attendance and win percentage
DMZ · November 21, 2006 at 9:03 am · Filed Under Mariners
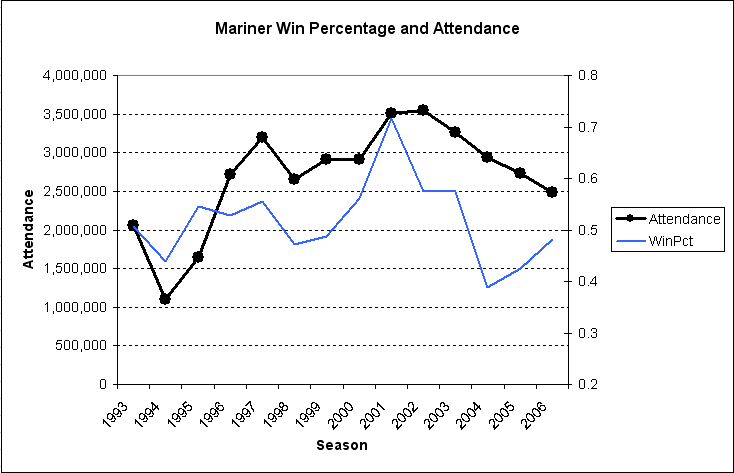
Full seasons since the Baseball Club of Seattle purchased the team in mid-1992
Comments
21 Responses to “Today’s graph is attendance and win percentage”
Leave a Reply
You must be logged in to post a comment.
Nothing surprising here. M’s suck, we don’t wanna pay good money to watch them suck.
That’s probably one chart that is hanging up in M’s headquarters. Perhaps minus that little blue line though.
The attendence is on a remarkably steady decline from the 116-win induced 2002 attendance.
This chart reminds me of how fun 2001 was.
I’m always amazed how much cheaper the beer is (and concessions in general) at *any* other ballpark. In the last year I’ve been to games at all levels of the minors, as well as Cleveland, Philidelphia, NYY, SF…
Bad baseball + expensive food = Find something else to do that evening.
Let’s not get this chart confused with the fact that the M’s are still making a gobs of money. It’s still 2.5M fans per year, plus their media deals are still cash cows. While I’m sure they want to reverse this trend, I doubt they are in desperation mode from a bottom line standpoint.
Speaking of media deals – anyone know when their TV and radio contracts come up for renewal?
1994 and 1995 are misleading because of the strike right?
Attendance per game might be better then.
How about a payroll to win pct chart?
That’s a cool idea, I should do that for my Rangers site. Thanks for the idea.
How about attendance to beer prices?
Let’s not get this chart confused with the fact that the M’s are still making a gobs of money. It’s still 2.5M fans per year, plus their media deals are still cash cows. While I’m sure they want to reverse this trend, I doubt they are in desperation mode from a bottom line standpoint.
On the other hand, those media deals make up a substantial portion of their revenues. Those deals ARE more senstive to recent won-loss records; I doubt very much that they’ll get much of an increase if they don’t show playoff contention next year.
I bet if we had an MVP like Justin Morneau, we’d have better attendance…
Bad hijacker! Bad!
#10 – The Mariners are in the midst of a 10-year, $288 million cable deal with Fox Sports Net, regardless of their win-loss record during those 10 years. I’m not sure of their radio deal but I wouldn’t be surprised if that was a multi-year deal as well. So those are guaranteed revenue streams (and huge ones at that) regardless of their record for the foreseeable future.
It’s like an unfun roller coaster.
Though the decline began back in 2003 when the team was still winning, the composition of the team had already began to grow predictably stale. That predictablility in roster construction likely led to the boring, predictable product on the field, even in winning, and help to begin the attendance slide.
This team not only needs to win again, but needs to find a way to truly energize and excite the fanbase.
Yeah, it was the boring roster, not the whole falling out of contention and missing the playoffs in 2002 and 2003 despite a winning record thing, that kept people away.
I’m always amazed how much cheaper the beer is (and concessions in general) at *any* other ballpark.
But it’s not as good. I went to three games in Toronto this season and the beer selection was appalling. Nothing but Labatt Blue and Bud. I did get a tasty Reuben sandwich, though.
16. Grizz, think: could the former have been a big factor in the latter? Predictability helps your enemies.
While I’m sure they want to reverse this trend, I doubt they are in desperation mode from a bottom line standpoint.
Perhaps not desparate from a cash flow point of view however, trends like that can cause cut-backs in painful areas and people can lose their job over. Couple this with a management team that has yet to figure out to put a winning team on the field in a city absolutely loaded with summer entertainment and I think it’s easy to be worried if your on the mnariner staff.
The problem with win pct vs payroll is that the cost of players keeps going up. Payroll rank, which was yesterday, shows you relatively how the team’s doing among its peers.
18: Not really. Attendance trails team performance by one year. The difference in attendance between 2002 and 2003 was primarily due to the ticket sales for games in the early months of the season. Coming off the 2001 playoffs, advance ticket sales were strong in 2002, and there were only a handful of games in 2002 in which the team drew fewer than 35,000 – even in April and May. In 2003, coming off a season in which the team was essentially out of contention by September 1, ticket sales for the early season games lagged significantly — games under 30,000 were common.
The M’s missed the playoffs those years because their players were not as good (in terms of both talent and performance) as their rivals, not because they were “boring” or “predictable.”
I would agree, however, that bad players who consistently make outs are “boring” and “predictable.”