
Mariner team defense since moving into Safeco Field
DMZ · October 19, 2007 at 9:39 pm · Filed Under Mariners
2000-2007, as measured using defensive efficiency: how many non-HR balls were put into play and turned into outs.
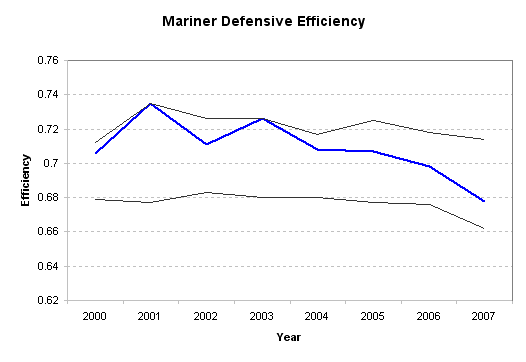
Top line is the best defense in baseball that year, bottom line is the worst defense in baseball that year. In 2001 and 2003 the Mariners were the best defense in baseball as measured this way.
Comments
37 Responses to “Mariner team defense since moving into Safeco Field”
Leave a Reply
You must be logged in to post a comment.
Gillick takes a lot of deserved flack but maybe he ought to get a little bit of credit for at least paying more attention to defense than Bavasi or some other GMs. This is especially true for the outfield guys with him adding Cameron, Winn and Ichiro. Now some of his IF guys like Boone, Cirillo and Olerud may not have been quite as good as their reps; or at least they weren’t by the time their Seattle stays ended. And I would imagine his criteria for evaluating defense might not be the ones that we would use. But at the last I think he deserves a bit of credit for at least paying more attention to defense- especially in the OF- moreso than Bavasi does and putting together a speedy outfield to run down those Safeco fly balls.
So… um… defense matters?
Of course defense matters, but this chart would also include pitching effectiveness (i.e. Having an effective groundballer on the mound is more important than having the talented infield to back him up). In other words, how much should the defense be credited for a pitcher who consistently gives up few hits? That’s not to say the graph is mislabeled, because pitching is the most important part of defense, but it is a little too broad to not be misleading.
All that said… holy wow, our D sucked this year.
It does, unless you are Manny.
Very informative chart.
Any chance of adding an AL Average or MLB Average line?
Not to beat a dead horse, but….
Since Dave says there are people in the FO who read this blog, if you are one of those people, could you please make sure Bill Bavasi gets a copy of the above graph (and the figure legend below it)? Pitching = expensive. Big bats = expensive. Improving the defense = not as expensive. Thanks.
Those 2001 Mariners where truley amazing.
Of course defense matters, but this chart would also include pitching effectiveness (i.e. Having an effective groundballer on the mound is more important than having the talented infield to back him up).
No, it’s not.
In other words, how much should the defense be credited for a pitcher who consistently gives up few hits?
Pitchers control walks, strikeouts, some debatable portion of HRs (whole other topic), and a very small amount of how many balls in play turn into hits.
That’s it.
That’s not to say the graph is mislabeled, because pitching is the most important part of defense, but it is a little too broad to not be misleading.
It’s not, and it’s not.
Go check out the DIPS research, starting with Voros’ work. Pitchers have very little to do with defense.
Two questions, was 2007 a down year for defense merely due to Ryan Braun?
More seriously, could you fill in where Seattle ranked vs the league in each year?
Ok, third question, is there a position dependent way to figure out DER?
DMZ, is almost all of this from LF? Winn -> Ibanez -> old and injured Ibanez
I understand your points in #8 and the DIPS theory (DIPS law?), and certainly the claims in 4 are incorrect. However, wouldn’t having ground ball pitchers who pitch the strength of the Mariners defense rather than flyball pitchers who pitch to their weakness, improve the team DER? Or is Ichiro so good and Sexson so bad that the outfield isn’t much worse than the infield? In general what’s the % of GB and FB that are turned into outs?
Interesting article about the Rockies philosophy (yay, they have one!)
Hmm, even at Coors Field, defense matters and the hitting coach could figure it out. Could that possibly be true also at Safeco? Nah…
http://mlb.mlb.com/news/article.jsp?ymd=20071019&content_id=2273040&vkey=ps2007news&fext=.jsp&c_id=mlb
I don’t get how that defensive measurement does not include pitching. If a pitcher sucks, he will throw more pitches that are hittable, and those hittable pitches will be hit harder, and more often as line drives, which would result in more balls hit into play that are NOT recorded into outs. If the pitcher was good, on the other hand, hitters would not hit the balls as hard, would hit them on the ground more or pop them up. So this defensive measurement of % of BIP recorded into outs has to be influenced by the quality of pitching. Could you say then that the downward trend is affected by the likes of Weaver and Ho-Ram?
To some extent: pitchers with horrible stuff get cuffed around more, but the reverse:
If the pitcher was good, on the other hand, hitters would not hit the balls as hard, would hit them on the ground more or pop them up. So this defensive measurement of % of BIP recorded into outs has to be influenced by the quality of pitching.
No. Pitchers have a very small effect on what happens to balls put into play against them.
Seriously, go look up the research on this and read up. It’s fascinating, if perhaps counter-intuitive at first.
However, wouldn’t having ground ball pitchers who pitch the strength of the Mariners defense rather than flyball pitchers who pitch to their weakness, improve the team DER? Or is Ichiro so good and Sexson so bad that the outfield isn’t much worse than the infield? In general what’s the % of GB and FB that are turned into outs?
Yes, but it wouldn’t be that huge either way in Safeco, where fly balls die.
And I don’t know the answer to that off the top of my head, except that I know grounders go for more slightly more hits overall.
More seriously, could you fill in where Seattle ranked vs the league in each year?
Ok, third question, is there a position dependent way to figure out DER?
You can go look it up @ BP, where each year’s ranked. I’d do it but I’m all data-entried out at the moment. The short version is “relatively, they’re about where they are between the bounds there”. I don’t know that ranking’s particularly useful.
Positional DER… kind of — this is what ZR/RZR/UZR and those play-by-play metrics try to do: how many batted balls are theoretically catchable by a player, and how’d they do at it? It’s tough, though.
Adam S/10: In general what’s the % of GB and FB that are turned into outs?
I’d suspect that there isn’t alot of deviation from these numbers in modern baseball on a year to year trend (although I could be wrong about that assumption):
GBs -> outs about 76% of the time
FBs -> outs about 84-85% of the time (non-HR FBs only)
What I always look at in a chart like this is the difference between the top and the bottom. Unless I’m misreading it, the difference between the best defense and the worst defense is about 1 hit every 25 non-strikeout at bats, a little less than one a game.
I know that baseball is all about small differences, but I expected the gap to be wider than that.
In response to #8:
The claims I make there are drawing somewhat from pages 92-3 in the paperback “Baseball Between the Numbers.” It’s a chapter by Dayn Perry, which I’ll quote here.
“In the final analysis, though, McCracken’s general observation still stands, leaving a truth that… It’s not that pitchers have no control over what becomes of a ball in play but that they have less control in that respect than they do over walks, strikeouts, and home runs.”
Then, on determining what factors actually are responsible for the fate of a ball in play, research apparently arrived at this breakdown:
“Luck: 44 percent
Pitcher: 28 percent
Defense: 17 percent
Park: 11 percent”
This would seem to show that the impact pitchers have on defense, while small, is not negligible. Wouldn’t having a pitching staff featuring a couple of inning-eating-suck-bots be partially responsible for grades of defensive efficiency?
That doesn’t support any of the refuted points, which were:
Of course defense matters, but this chart would also include pitching effectiveness (i.e. Having an effective groundballer on the mound is more important than having the talented infield to back him up).
This is not true.
In other words, how much should the defense be credited for a pitcher who consistently gives up few hits?
I guess you found the answer to that then.
That’s not to say the graph is mislabeled, because pitching is the most important part of defense, but it is a little too broad to not be misleading.
So now you’re arguing that luck is the most important part of defense. Okay.
But that’s not at all what Perry’s quoting there: he’s quoting the Tango et al regression study, which is a different way of approaching it than Voros/Tippett/Woolner used… and it’s not necc. predictive of future results, like all regression.
And then we’re really arguing that what a pitcher does there is control GB/FB, which in turn affects the hit rate… and on and on.
I guess I don’t understand what you want from the graph: a detailed breakdown of each of those four factors, by year, as they form the total DER? I’d love to see that if you figure out how to work it out.
The graph’s supposed to be a high-level view, nothing more. DER’s a rough measure, the graph’s a rough picture.
Defense might get a little better for next year. Guillen won’t be back.
All I’m saying is that the graph led me to wonder what percentage of this year’s decrease in DER was not directly influenced by Mariner position players. Would taking the results from the regression study by Tango et al tell us that it’s possible that 28 percent of this year’s decrease was due to the bad pitching and 17 percent was due to bad fielding?
Of course the study does not necessarily predict future results, but the results come from a valid analysis. I’m not saying the graph is missing information, I just look at the graph and wonder what variables are at work here besides Mariner position players.
Sort of on topic…it looks like Guillen is going to become an FA, which should bode well for improving at least one OF spot next year.
[ot]
DMZ – the research in this area is very interesting, and I agree generally with the contention that once put in play, the pitcher has very little to do with outcome. However, it seems that in reading some of the analysis you referenced above, the analysts have given short-shrift to the idea that the pitcher has a *lot* of control over what kind of ball-in-play is generated for the defense to handle.
As is often the case in saber-type analysis, I wonder if there’s a problem here with recognizing a real skill because it’s hard to measure?
I mean, it seems obvious that if you or I were on the mound, the defense would have its hands full, regardless of their skill level.
GB%/LD% are exceptions to this general observation, and are therefore very interesting. It’s not surprising that they are generally decent forward indicators of pitcher effectiveness.
I’ve looked around for more research on the subject of what kinds of balls-in-play are allowed by individual pitchers. It would be interesting to see, for example, where the outs are made in a specific lineup with Jamie Moyer on the mound as opposed to, say, Ryan Franklin or Ho-Ram. I suspect (but can’t prove) that an unmeasured but tangible skill that pitchers have is influencing the location and energy of balls put in play.
Any further recommendations on where one might find more specific research in this area?
Changing out Guillen is going to make a pretty small defensive difference (assuming they replace him with league-average defense, that is). The black gloves are Sexson’s and Ibanez’s. Swap in Jones for Ibanez and you’ve made a big improvement, but Sexson’s probably not going anywhere. How much worse he has to get to get fired is anyone’s guess, but the Mariners are probably more inclined to hold onto that sunk cost longer than anyone. Loyalty, veteran leadership, you know the drill.
If everyone else stays the same, and the only upgrade they make is Jones, that’s a solid uptick on the graph next year. But does everyone else stay the same? Does Lopez hit enough to keep his glove in? Does Betancourt figure it out, or does he regress even further? Do they replace Guillen with someone good, or the 2008 version of Ancient Mariner Sweepstakes (which is my guess)?
According to at least one advanced defensive metric, UZR, Guillen was the worst defensive right fielder in the majors last season (-21 runs) which says a lot considering Jr is a right fielder now. A healthy Guillen probably isn’t that bad consistently but I’m willing to accept he’s legitimately 10 runs below replacement with the leather.
Should defensive statistics be at all relative to the amount of square footage available in each venue?
I imagine with more square footage to cover, you’re going to get to less balls in the outfield.
I suspect (but can’t prove) that an unmeasured but tangible skill that pitchers have is influencing the location and energy of balls put in play.
There’s been a lot of theorizing and general complaining about this, and the short answer is that I don’t think anyone knows.
The long answer is that we do see that certain pitchers are better at preventing hits on balls in play than you’d expect, and they share certain characteristics — Tippett gets into this — but the kind of detailed analysis I think you’re looking for hasn’t been done yet.
Like… do curveballs with more than 6″ of break turn into outs more often when they’re put into play? Flat fastballs go for more hits?
We don’t know.
Or, rather, the people who have the resources and tools to do that kind of research are teams and companies like BIS who aren’t sharing. It’s possible that if sabr-heads get access to consistent PitchFX data we’re going to make some huge breakthroughs in this research.
Should defensive statistics be at all relative to the amount of square footage available in each venue?
Relative? No. But park effects play a big effect in pitching statistics, and Dave’s done work showing how fly balls die in certain areas of Safeco Field, so you certainly want to take that into account.
17 – “What I always look at in a chart like this is the difference between the top and the bottom. Unless I’m misreading it, the difference between the best defense and the worst defense is about 1 hit every 25 non-strikeout at bats, a little less than one a game. I know that baseball is all about small differences, but I expected the gap to be wider than that.”
I’m probably the one misreading it, but I don’t see how you get that number. This year looks like every, what, 18 or 19? And the difference between the Mariners’ best and worse is 17.5 or so?
I’m not good at this, so I’m probably doing it wrong, but the % difference looks 5.7 or so for the M’s and 5.5 or so between best and worst in the league this year.
Which seems like it would actually be closer to two hits a game… which seems pretty significant.
re bad pitchers giving up more hittable balls and isn’t that part of defense.
All of the analyses are predicated on a population of pitchers that have a minimum threshold of ability to be MLB pitchers. That translates to a minimum ability to keep batters from squaring up pitches. When guys square up pitches, they drive the ball and very high percentage of batted balls go for hits. Generally, if guy is consistently giving up hits on one-third or more of balls in play he probably isn’t going to pitch for very long.
Once a pitcher does cross the threshold of mimimum ability to miss bats, then the random effects of where a ball is hit dominate the results. Since keeping batters from squaring up pitches is a skill that pitchers have, we ought to expect that even at the MLB level there will be some residual evidence of that skill. And there is – some pitchers do have a demonstrably better ability to sustain a lower BABIP. But even in those cases, that skill is generally dominated by the simple randomness of where balls are hit when batters do make contact.
I’ve seen people abuse the notion that some studies have indicated certain pitchers have a demonstrable ability to effect the outcome of batted balls in to play by overreaching the data to the degree of arguing defense-independent metrics are invalid because hits are largely ignored. It’s important to remember, that those studies suggest that only a select minority of pitchers display such a measurable ability and even then the effect is very small especially relative to other factors.
As Derek points out, enhanced game day data will allow this question to studied in a way that hasn’t been possible before but as things stand now, the effect of pitchers on the fate of batted balls has to be considered small enough to ignore in most cases. I suspect adding pitch movement/location data will only better clarify why the few pitchers with measurable ability have such an ability. DIPs theory probably isn’t going to get dramatically revised but enhances game day data might provide a marker that allows clubs to better select/develop pitchers that might otherwise be under valued.
According to the defensive posts on this site, which I trust more than UZR, Guillen is “below average” but not terrible. Ibanez is worse, and Sexson is much, much worse — as much as 20-25 runs below average — the worst in baseball. Can’t hit a lick, either. Hmm. If only first base wasn’t the hardest position to fill.
Really? More than UZR? I feel full of pride.
It would be interesting to see the defense efficiency broken down by home vs. away. It would seem logical that any difference between home and away would likely be explained by one of two factors: the amount of outfield, and the amount of foul territory.
It would also be interesting to see what the defensive efficiency was between innings where Raul was in LF, and those when he was not. If the consensus is correct, than the DEF should be higher when Raul is not playing LF than when he is, although the number of innings when Raul did not play LF would be a relatively small sample size. While I understand that any difference couldn’t be attributed to Raul, it seems that such a study might shed some light on the situation. In fact, why not conduct such a study for all of the positions? I would love to see a study of Jose Lopez and Richie Sexson…
OK, I did a rough calculation of the team’s DEF home vs. away….using the following calculation….DEF = 1-((H-HR)/(PA-(K+BB+HBP+HR)). It’s not exactly accurate, as it doesn’t account for # reached on error, for example, but I get a DEF at home of approximately .688, and away .681.
More later….
30: My calculation is .72 – .68 = 0.04 = 1/25 It might be a little closer to 0.05 but that’s 1/20, so still about a hit a game.