
Small graph for Sunday
DMZ · March 2, 2008 at 3:50 pm · Filed Under Mariners
I put this together after I realized that the 2003 M’s outfield included two of the franchise’s all-time putout leaders at their positions despite those players not getting full seasons.
Unless I messed up, this the total putouts by Mariner outfields since 2000:
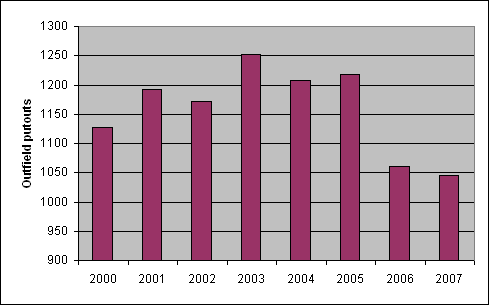
Note, of course, that this doesn’t take into account whether the staff was made of groundballers/flyballers/gopherballers, and other stuff.
Update: check out this further exploration o’er at Lookout Landing
It should, however, take Raul Ibanez into account.
That’s terrible. It doesn’t even look real to be honest.
Holy visual distortions Batman!
You’re right Gillis27, it doesn’t look real. Starting the baseline at 900 gives a deceptive impression of how much the results vary from year to year as a percentage of total outfield put outs. Yet, it makes the point that within that variation, the current Mariner teams are probably not good defensively.
I swear, every time I put up a graph, I can’t win for losing. Starting from zero minimizes the difference because even the worst outfield manages to get 1,000 putouts.
Ideally, I’d put up two bands for “worst ever” and “best ever” to bound it, but I didn’t. Patches welcome.
The change from 05 to 06/07 is approximately 1 out a game it looks like. As DMZ said it doesn’t take in account pitcher types but having to get an extra 150-170 outs a year will take its toll on pitcher count, IP and RA for sure.
Didn’t Ibanez start playing LF full time in 2006?
Ben Ramm,
If visual distortion were the objective, Derek could have started the base line at 1000 put outs, for an even more startling graph. It would have still made perfect sense: Last years’ outfield recorded about 85% of the put outs that 2003’s outfield managed.
This raises a lot of interesting questions, but them’s the facts.
Two words. Ryan Franklin.
Starting the baseline at 900 gives a deceptive impression of how much the results vary from year to year as a percentage of total outfield put outs.
Yet apparently you were not deceived. Why? Because you looked at the well-labelled axes on the graph.
Ben Ramm 3 –
This graph would not really show the quality of the defense. The same number of outs is recorded in every ballgame regardless of how many fly balls fall for hits. This would reflect more closely the FB/GB tendencies of the staff.
It could reflect that. But what else would show up?
DMZ: I believe the answer you are looking for is an aging and defensively inept outfielder, but what do I know, I just see eight purple bars and think of grape juice 🙂
Although it’s interesting to think how 1 out/game over the course of a season can drastically change things up. DMZ can you try to remember to run this same number after the ’08 season, I’d love to compare.
10 No doubt the FB/GB/SO tendencies of the staff will greatly affect the number of outfield outs. But so too can outfield defense (or infield defense, for that matter). The only way the graph would NOT show defensive trends would be if the pitchers involved were 100% FB or 100% GB or 100% SO pitchers. But that is a crazy scenario.
FB/GB ratios are constant, regardless of defense (or they should be within certain constraints, it seems to me). How many of each are converted into OUTS depends on defense. If the outfield defense is bad enough, ALL the outs will be recorded by the infield, even when Washburn is pitching. Just because 60% of the balls are hitting the outfield doesn’t mean that 60% of the outs come from there too.
Okay, I don’t study sabermetrics myself. But I was good at math in school and got a perfect score in it on the GRE. And I think we can prove this easily with arbitrary numbers. So, I am going to give it a go.
Suppose that X is the percentage of GB’s turned into outs and Y the percentage of FB’s turned into outs, and let [GB%] equal the ratio of GB’s on balls in play, and [FB%} equal the ratio of FB’s. Then, the ratio of FB outs to GB outs will be:
[GB%]*X / [FB%]*Y
Now, what will happen as Y decreases? Fewer FB outs even with the same number of overall FB’s. Outs will skew towards GB’s even when the overall rates don’t.
So let’s make up some numbers with no regard to reality. Lets take pitcher Z with a GB/FB ratio of 35/65, assign the arbitrary GB conversion rate to .8 and the FB conversion rate to .7. Then:
GB / FB = 35 / 65
GBO / FBO = (35*.8) / (65*.7) = 28 / 45.5
so, about 62% of the OUTS are from FB’s.
But then suppose that the outfield defense sucks enough to drops just one more ball a game. Then:
GBO / FBO = 28 / 44.5
In this case, only 61% are converted into outs. So now 39% of the outs on balls in play are from GB’s, rather than 38%, even though the overall ratio on balls in play is the same. Which means that yes, this graph could have significant implications for our outfield defense.
Wow, that may be the comment of the week right there.
You inspired me Derek
The only outfield I can think of off the top of my head that’s worse than the Mariners’ is Boston’s (they were god awful, mainly dragged down by Drew’s -10UZR).
They recorded 955 outs in the outfield this year. Now before anyone goes pointing to that as proof that bad defense = fewer OF putouts, remember that their pitchers recorded 130 more strikeouts than ours did.
For comparison, Boston’s 2002 outfield, which was dramatically better with a Manny splitting his time in left with Rickey Henderson, Damon in center and Nixon in right, recorded 980 outfield putouts. More than this year, sure, but not enough to account for the defensive differences between the two teams.
I’m afraid I’m giving the wrong impression here. I understand that a 50/50 gb/fb pitcher (no one seems to be able to square up and get a LD off this particular guy) will record a couple more outs on the ground than in the air if playing in front of a terrible defense. I’m not contesting that.
However, this cannot account entirely for the 200 PO difference between 03 and 07. Follow Matthew’s link and you will see that while defensive efficiency was down (78% in 03, 71% in 07 and I’m only looking at FB for simplicity’s sake) so were to total number of outfield flies.
Besides, Pygmalion, the infield defense wasn’t all that this year either. Between Sexson alone could almost entirely compensate for whatever offset the poor OF D created.
Oops. I started typing ‘between Sexson and Yuni’ and decided to blame Sexson alone later. Not technically a violation of the button agreement but I apologize all the same. I’ll stop now.
You can’t talk about Boston’s outfield defense without adjusting for the Green Monster. It’s a huge, huge factor. Manny’s a bad defender, but Coco Crisp is pretty terrific in center, and Drew was significantly better than Guillen last year. The Red Sox OF defense last year was far better than the Mariners.
No doubt about it, different parks play differently, which is why I was comparing the 02 sox to 07. Crisp is a good defender, yes, and Drew… oh balls. I just realized that I saw a midseason version of UZR where he was at -10.
I don’t know how he ended up rating, I was surprised to see him down so low myself but thought it must be injuries. At any rate, as someone who’s been paying attention to defensive ability much longer and closer than I have, can you think of any egregiously bad outfields from the last half decade?
How about the Reds? 2006 they had Dunn in left, Griffey in center, and Austin Kearns/Freel in right (and in 07 it was Dunn/Hamilton/Griffey).
The 2005 Reds outfield was Dunn/Griffey/Kearns+Willy Mo Pena. I shudder just to think about it.
Yea, the Reds outfield defenses of the last few years have been abominations. Last year, Tampa ran out some outfields with Delmon Young in center field and Jonny Gomes in right field that were crimes against humanity. The ’05 Yankees had Matsui-Bernie-Sheffield and had the combined range of a potted plant. The ’04 Tigers had Rondell White, Alex Sanchez, and Bobby Higginson.
I really dislike PO as a defensive stat, at least when applied this broadly. I understand all of the caveats and concessions already made, and know Derek and Dave are just throwing this out as a sort of “hey, check this out but understand there are lots of variables at work here”. Comparing the best and the worst years (2003/2007), I’d like to look at the infield PO for each year as well, to rebut pygmalion’s post a little. All numbers taken from baseball-reference.com
2003 2007
OF PO 1252 1045
IF PO 2070 2238
K 1001 1020
Total 4323 4303
IF PO was calculated including Pitcher putouts and Catcher putouts, with strikeouts subracted from the Catcher putouts. 2007 Pitchers recorded 73, 2003 recorded 112. If you’d prefer to throw those out, bringing the numbers to 1958 and 2165.
Basically, if we are to look at the IF PO like Pygmalion has suggested we might look at the OF PO, we could draw significant implications about our infield defense as well – in this case being that they’re far superior to Olerud/Boone/Guillen/Cirillo, which I imagine some might contend (though I’m no defensive metric whiz so maybe not).
Point being, in solitary, it does not indicate a problem with the M’s OF defense anymore than it indicates a stellar IF defense. An increase of IF defensive ability would decrease OF PO, but it doesn’t mean the OF defense is getting any worse.
All of that being said though I am pretty much in agreement that the OF defense is cringe-inducing, but this alone is (IMO) a pretty poor method to try to prove that.
Hmm I guess it removed the spaces from my ‘table’ but it’s still pretty readable. Also would like to add another quick thought on using putouts to measure a teams defensive strengths. A team with incredible defenders at every position could record 2000 IF PO and 1000 OF PO, while a team with completely inept defenders at every position could record the exact same 2000/1000 PO numbers. You wouldn’t be able to judge which team has the better OF defense based on those stats. Likewise a team with average OF defense and poor IF defense could record numbers of 1900/1100 and a team with great OF defense and average IF defense could record 1900/1100 as well.
what happens if you remove Ichiro! from the equation(s)?
The equation gets really angry and refuses to cooperate. I know I would.
ok, I’ll just mentally remove the top chunks of all the graph bars, then 🙂
Thinking of that just gave me a stomach cramp.
The only way you could compare OF PO % (I need more initials), is if the pitching staffs were the same for each year. Or, if not the same at least had the same GB/FB %.
That isn’t to say that I don’t agree with the premise that our OF defense lags behind many Little League teams.
You don’t need to have the same staffs or even the same ratio to be able to see useful data there.
Also see the other link, where Matthew looks at changes in the pitching staff.
Re: Deceptive graphs.
I’m strongly of the opinion that you cannot deceive people with facts. As long as all the information you present is accurate, any false conclusions drawn by the reader are entirely the reader’s fault.
So, great graph, Derek.
Would bad IF defense really have that much of an increase in OF POs? I would say it is fairly safe to assume any missed opportunity for an IF PO is not then converted to a PO by an OF as the runner is most likely safe at first.
Now of course the next batter might hit one in the air but only at the same rate as the current pitcher’s FB % and then they still have to convert it to an out. It would seem logical that an OF that converts a much higher than average % of FBs into outs playing behind a defense that converts a much lower than average % of GBs into outs would begin to make a difference.
But I would think over the course of a season the overall difference wouldn’t be that big as there is still a pretty good chance that a PO that is missed by an IF will still become an IF PO but from a subsequent batter. Of course the GB/FB tendencies of the staff would have a fairly significant impact on how frequently the missed IF PO turns into an FB which can then become an OF PO. That said I wouldn’t necessarily think bad IF defense means more OF POs especially if you have a GB % pitching staff.
sorry last line should say if you have a HIGH GB % pitching staff
32 – you’re right in the sense that a missed IF PO would not directly result in an OF PO, and I think I see where you’re coming from, but look at it this way, strictly mathematically. Let’s just assume all 162 games are played the full 9 innings for a team, so that’s 4374 total outs. For numerical ease, let’s say 1374 of those are from strikeouts. Assuming a drop in IF PO numbers, from say 2100 to 2000, it would lead to an increase in OF PO’s. Think of it like a simple equation
OFPO+IFPO+K=Total outs
or
OFPO+IFPO=Total outs-K
Assuming Total outs and Strikeouts remain constant, a decrease in IF PO would HAVE to lead to an increase in OF PO.
You’re looking at it in an at-bat by at-bat sequence – I’m looking at the final tallies. I’ll run through two short example inning to try to explain better:
Groundout to SS
Flyout to CF
Grounder to 3B, but Sexson bumbles the catch and the runner reaches on an error
Fielder’s choice to 2B
Groundout to SS
Flyout to CF
Grounder to 3B, but Sexson bumbles the catch and the runner reaches on an error
Flyout to CF
In the first one, there are 2 IF PO and 1 OF PO. You’re right in the sense that the missed opportunity for a PO doesn’t directly lead to an increased chance for an OF PO. But, there were still 2 IF PO recorded, and only 1 OF PO. In the second example, there is only 1 IF PO, therefor there must be a 2 OF PO to make up for it (assuming no K’s).
I’m looking at the final stat line, and putting it into the equation above. An decrease in the FINAL TALLY of IF PO must mean that either K or OF PO increased (assuming a constant number of Total Outs).
If this is the wrong way to be looking at it though someone please let me know, I’m just trying to sort my way through and rationalize the possible meanings of the graph.
Take it to the extreme. If you had no infielders, literally no one, OF putouts and K’s would go up. They will eventually get 27 outs per game (or 24 losing on the road). Likewise, if you had no fielders, pitchers K’s would go up. They’d K approx 3/IP (minus popups to P and C). Now per plate appearance they wouldn’t change much, but per IP they have to go up.
34 I totally agree that a decrease in IF POs would have to increase OF POs and/or Ks. My main point was does a missed IF PO really decrease the total # of IF POs that are tallied.
I think your examples sum it up though in that there are certain situations where a missed IF PO does lead to decrease in total IF POs but also there are situations where it just turns into a different IF PO. Which is why I concluded the GB tendencies of the pitching staff might have a bigger impact on how often a missed IF PO is then turned into an OF PO.
I guess where I need to go from here is some kind of formula based on % of FBs GBs and missed opportunity, which I’m probably not smart enough to figure out on my own.
OK I see what you’re getting at now. If we assume a 2:1 GB:FB ratio and 75% IF PO efficiency and 75% OF PO efficiency, we should be able to make an equation (or probability tree? not sure) that establishes what a decrease in IF PO efficiency would do to total OF PO.
Someone correct me if I mess up math or do something I shouldn’t here, but I’ll try to figure out what that would look like here. Assuming 1:1 ratio and 50% IF and OF PO efficiency, for convenience (eliminating K’s and BB’s as well). I think the easiest way would be to look at it like a probability tree. For any at-bat, there is a 25% chance of a IF PO, missed IF PO, OF PO, or missed OF PO. So for each at-bat, we assume .25 of each, correct? We need to accrue 27 outs through this, and since each at-bat yields half an out that’s 54 at-bats per game, totalling 13.5 IF PO and 13.5 OF PO. If we knock down the IF PO efficiency to 25% but leave the 1:1 ratio the same, each at-bat is now worth .25 OF PO, .25 missed OF PO, .125 IF PO, and .375 missed IF PO. Still needing to amount to 27 outs we now have to raise the number of at-bats up to 72, and end up with 18 OF PO and 9 IF PO.
Even though the numbers I used are completey ridiculous, it looks pretty apparent after doing all that the an inferior IF defense WILL increase OF PO, and vice versa. Using the same logic you’d have to assume that K’s wouldn’t stay constant either, and would actually increase as the defense gets worse. Counterintuitive at first, but I guess it makes sense.
In order to figure out how MUCH an increase/decrease in IF or OF PO efficiency changes the other (and K’s too) you’d have to plug in the actual numbers.
BTW, if someone more math-minded than I can put that into an actual equation that would be sweet. Hope I did everything right.
I think you’re heading in the right direction there. Of course in reality we couldn’t eliminate Ks, so there is a chance a missed IF PO turns into a K instead of an OF PO.
I did a little work and last year the 5 pitchers anticipated to be our starting rotation averaged 6.84 K/9, so without looking at relievers and to use whole #s for simplicity let’s say we average 7 Ks a game leaving 20 POs between IFs and OFs outside of Ks.
Then I averaged their FB/GB rates (just last season again) and came up with 1.484 so there is about 1 1/2 GB for every FB so if we apply that over 20 POs we get 12 IF PO and 8 OF PO. (Not accounting for infield flies but this is really rough so if anyone can refine this, by all means please do) So say the IF misses 20% (arbitrary # for a really bad D) of their reasonable PO chances and we’ll say they miss about 2 1/2 a game.
We’d then reapply the % so there is about a 25% chance we get a K, about a 45% chance we get another GB and about a 30% chance of a FB. So on the whole if an IF missed 20% of it’s reasonable chances, and the OF converts all it’s reasonable chances it would turn into a little less than an out a game.
But here is where the GB/FB tendencies might make a difference. Let’s look just at Washburn from last year. He struck out a little over 5 a game so we’ll say his starts leave 22 POs avail. He had a .84 GB rate so over 22 POs that would work out to about 12 OF POs and 10 IF POs. So the IF has a little less chance to screw up in the first place, so at a 20% error rate they miss 2 a game. Wash then has about an 18% chance that turns into a K, only a 37% chance of a GB, leaving about a 45% chance of an FB. Which with the lower # of opportunities it still is a little closer to 1 a game but still a less than 1 whole out shifted a game. So in reality since the FB pitcher is giving less opportunities to the IF it doesn’t really make a huge difference in how many of their missed IF POs turn into OF POs contrary to what I thought, although there is a small variation.
So I guess that would add up over a whole season, but I wouldn’t say it is a huge factor in the # of OF POs generated. And as I mentioned earlier you would need to decrease the total # of OF POs because some of those FB outs are going to be caught by an IF.
Also I have no idea what the normal % of GBs turned into outs is compared to FBs so that could skew the #s as this formula implies that an exactly proportionate % of GB/FB allowed turns into outs. IIRC I think a higher % of GBs are turned into outs so that would further decrease the # of missed IF POs that turn into OF POs because even if the next batter does hit a FB it is less likely to be converted to an out, again IIRC. Well that’s the longest post I’ve ever written but I hope at least one other person finds it interesting.
I don’t know if this has been posted, but [deleted, off topic]
[metacomplaining]
Unless those predictions, sequences, and numerical consistencies accurately represent the talent level of the team. If you’re going to throw out analysis and leave it to the “playing the game” factor, every team has an “legitimate chance to win the Division,” they’re all living, breathing MLB baseball players actually playing the games.