Three views of a start
I’ve been playing with the Pitch FX data from Felix’s last start. This is the first time I’ve used Pitch FX data like this (Dave, obviously, is a little more familiar). I ask for forgiveness in advance if I’ve flipped an axis or something similar.
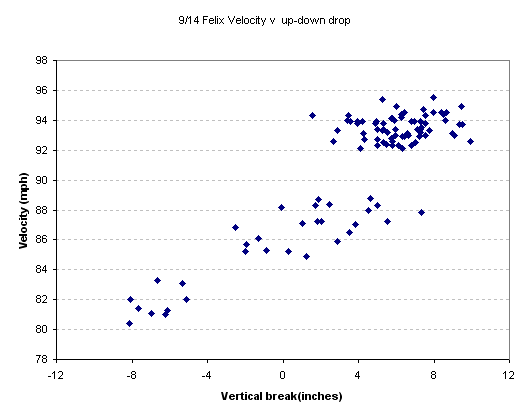
Velocity: this is the speed of the pitch as it leaves his hand
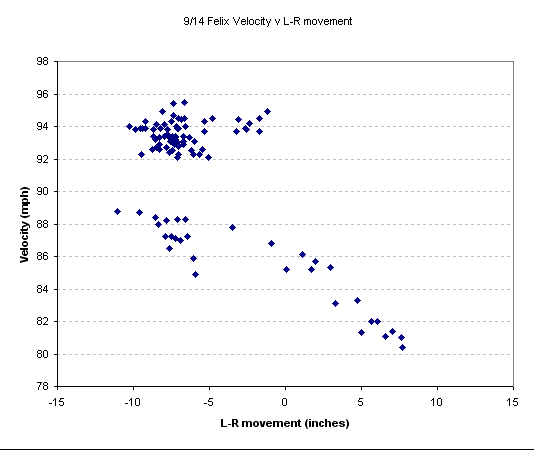
L-R break: this is taken from “pfx_x”. Positive is to the catcher’s right, negative to the catcher’s left.
Vertical break: this is taken from “pfx_z”. Positive numbers mean it rises, negative that it drops.
I mention that because the way break is handled will seem a little weird. It’s measured from a straight line, for instance, not from an average pitch. And for vertical break, gravity’s effect is removed, so you’re measuring is how much more or less the ball moved.
So this is easy:
You can almost label the pitch groups there. We’re all familiar with that. Two more, then:
I don’t think I’d seen that chart done before: the grouping’s not nearly as neat, but the fast ball came in to righties.
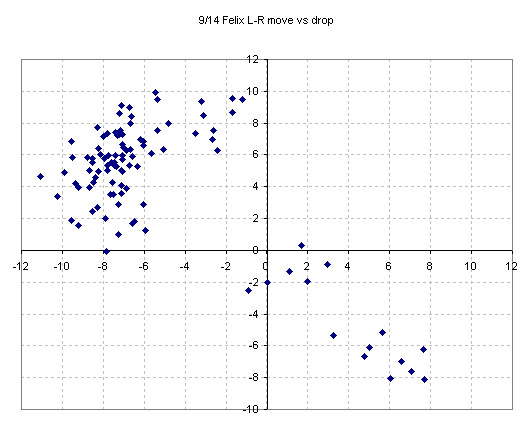
Then both movements:
You can see the huge difference in how his stuff can move, and this is part of why Dave’s been so passionate about the need to mix the pitches up. There’s a huge grouping of pitches there with essentially similar overall movement and then the really sweet breaking stuff forms an outlier. If the movement on those pitches is the same, then varying velocity becomes a necessity for success. And moreover, if there’s one set of pitches come in and up and another pitch that drops wickedly and runs the other way, that’s a huge potential weapon that can also be better used.


Can somebody run this through an Old Baseball Guy babelfish translator so that The God Miracle Mel can understand it and then relay it to Felix?
You know, these pitch fx graphs are the very first graphs of pitching data I’ve ever seen that really turns a light on inside. Seeing the same data from three directions helps immensely, too. I’ve seen “data” like this before, which was at least partly imaginary, and probably wishful thinking. These look totally real, and totally alive.
I want to print them out and study them. I want Dave to weigh in too, at length; preferably tremendous length. I think it’s exciting stuff, not because we haven’t seen the data before but because a picture really is worth a thousand words, and these graphs are almost like holding the entire game in your hand.
Great stuff, Derek.
Shouldn’t we be looking at two versions of each graph, one when facing right-handed hitters and one when facing lefties?
Why?
“Can somebody run this through an Old Baseball Guy babelfish translator so that The God Miracle Mel can understand it and then relay it to Felix?”
I tried, but the Babel fish translation no matter how I word it is “Establish the fastball.”
How do we know this?
Couldn’t location be just as useful if not more useful than speed?
I know this would add to the difficulty in constructing the post, but I feel like the graphs comparing break to velocity would be significantly more interesting if it were plotted on a single, 3 axis graph.
Why?
Do we think Felix uses the same pitch selection for lefties that he does for righties? Does he have the same success with both? If the goal of this is to try to see what makes Felix a better pitcher, and we think pitch selection is a big part of that, and his pitch selection is different for different-handed batters….
I find Excel graphing pretty frustrating: anyone who wants to help me graph it on a “single, 3-axis graph” is welcome to. I was fooling around with getting the pitches to color-code by velocity.
w/r/t L/R: I see. In general, I think I agree, though the “shouldn’t we” made me think there was something wrong with the graph rather than a feature request.
The gameday data’s out there — you’re welcome to crunch it yourself. I thought presenting it like this w/o a breakdown was interesting enough to warrant the post. Maybe next time I’ll see if I can break it out L/R if that’s interesting.