Hisashi Iwakuma’s Outing Today
It’s easy to be paranoid on a day when we’ve just learned that Drew Smyly may not be ready to pitch when the season starts. I look forward to laughing about this in a month after Hisashi Iwakuma twirls a few gems against Houston, Texas and Miami. It may be premature, given that there are questions about the Pitch FX calibration in Peoria, so maybe the velocity readings aren’t as bad as they look.
But here, look at this:
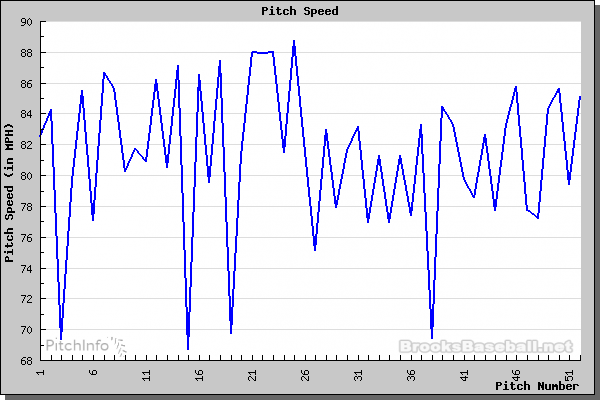
This was Hisashi Iwakuma’s velocity today in his abbreviated start against the Dodgers. This is from BrooksBaseball, who’ve taken the raw MLBAM Gameday data and adjusted it to measure the speed at 55′ from the plate as opposed to 50′. That means that these readings are actually faster than what you’d see in the Gameday app, where Iwakuma appeared to throw a blizzard of 82 MPH “change ups.”
The first inning looks OK (through pitch 27 in the chart), with a couple of sprightly 88 MPH fastballs to Tyler Holt, followed by an oddly slow slider that Holt singled on. But look at the stubbornly low velocity immediately after that. He begins the 2nd inning with a walk of ex-Mariner Chris Taylor, and none of the pitches exceed 84, leading Gameday to call them changeups. The problem is that they very clearly aren’t. His velocity gets slightly better towards the end of his outing, but it’s still far below where it was in the first inning.
Clayton Kershaw’s velocity was slightly lower than usual today too, so it may be that after further adjustments, Iwakuma’s 83 MPH fastballs were really 85-86 MPH sinkers – something low, but not THAT low. The problem is that while the M’s are saying there’s nothing physically wrong with him, and Iwakuma himself blames mechanical issues for his wildness, that picture is exactly what an injury looks like.
There are, of course, other explanations. This spring, Iwakuma’s been a little slow out of the gate with his fastball. Here’s a velo chart from a few outings ago, where we started off 85-86 and then worked up to 88.
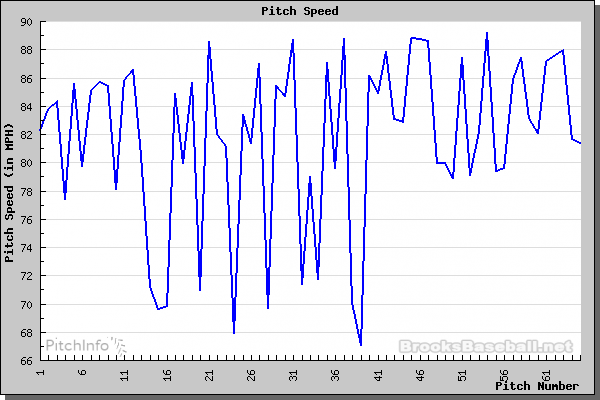
Since his outing ended in the 2nd, maybe he just never got loose. That might explain the velo and the wildness (four walks? From Hisashi Iwakuma?), but is a warning sign of its own.
Still, it’s scary to see such a drop after a frankly odd-looking slider; it’s not good to be able to look at the chart and instantly spot where…something happened. Iwakuma’s thrown a few sliders this spring, but none as slow as that 75 MPH hanger to Holt. It’s 5 MPH slower than he averaged last year, and it appears to be the only slider he threw in today’s game. I sincerely hope Iwakuma just tried to work on his mechanics in the 2nd, and, for whatever reason, it didn’t work. But this is now something to watch, in between watching for news on Drew Smyly’s health.
Please stay healthy, M’s.
Felix and the Low Fastball
I should probably be writing about Drew Smyly, who’s suddenly sidelined with what he called a “soggy” arm, and may not be ready for opening day. But I’m going to write about Felix, and I will attempt to make it topical by saying that Felix is suddenly even more important to the M’s 2017. With the bottom of the M’s rotation in a bit of flux, and as we all wait to hear why Drew Smyly’s arm is suddenly taking on water, the M’s need a bounce-back season from Felix more than ever. The M’s were never supposed to be a dominant run-prevention group, but the return of Good Felix makes the M’s path to contention a whole lot easier.
The M’s attempts to restore Felix’s regality took two paths, as detailed in this great Ryan Divish piece from late last year. First, Felix had mechanical problems which impacted his command, and second, he targeted the bottom of the zone almost exclusively, allowing hitters to either take low fastballs and draw walks (his 2016 walk rate was the highest of his career) or wait for him to throw a get-it-over strike higher up. The theory, as described by Jerry Dipoto in that Divish article, is that hitters got comfortable against him knowing where he was going to spot his fastball.
An objection I’ve heard on Twitter and one I talked about back in June is that it’s dangerous to so completely change a pitcher’s plan of attack; Felix is Felix because of his great sinking fastball/change – if you try to force him to elevate four-seamers, something he hasn’t done much of since he threw 97, he could really struggle. Well, in this case, I’m fully on board with the M’s change of strategy. Felix’s 2013-14 peak (by fWAR) and his 2015-16 struggles have coincided with some fairly large-scale changes in how the league attacks low fastballs, and batters have made adjustments that make them much better against low fastballs than they were even a couple of years ago.
Jeff Sullivan pointed this out at FG a while back, but the spike in home runs last year did not come from batters driving more high fastballs. Instead, it was largely the result of a sea change in how they attacked *low* fastballs. Jeff compared 2008-2015 with 2016, while I’m going to focus on the past four years. Here’s a graph showing the league’s slugging percentage on fastballs in the lower third of the zone (and below/to the side of the zone) and on fastballs up (and out of) the zone. Batters fared better on low FBs – barely – in 2013, but the gap has grown thanks to a jump in results on low FBs in 2015 and 2016.
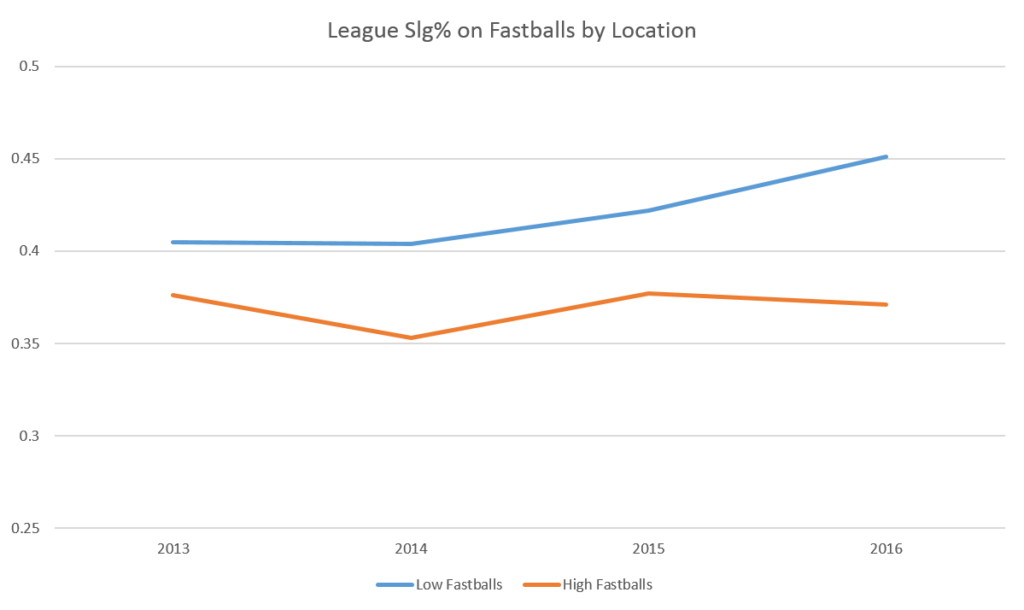
I’m using SLG% because it incorporates both batting average AND power; it makes sense that low FBs have a surprisingly high SLG% because there are a lot of singles and ground-ball hits in there. IF we focus just on home runs, the change is even more evident:
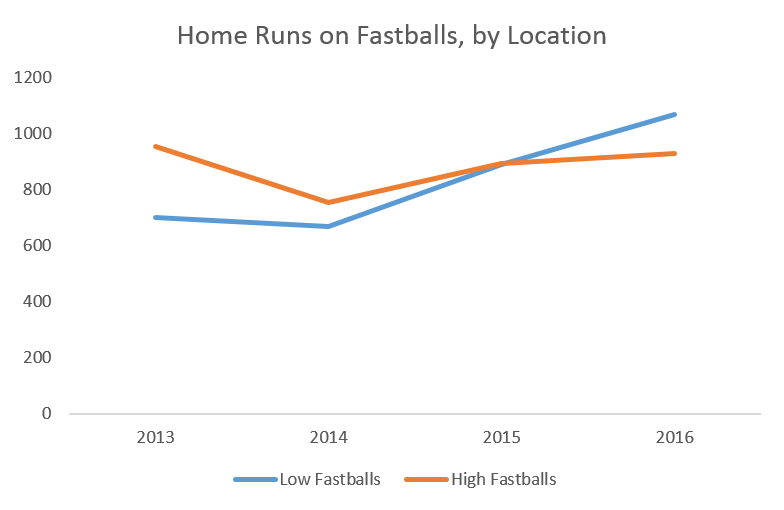
HRs on low FBs overtook HRs on high FBs in 2015, and while HRs were up everywhere in 2016, low FBs were much more likely to go for HRs in 2016. Batters have adjusted not just to low pitches, but to low FBs. It’s not about putting more of them in play (balls in play rates continue to drop), they are doing far more damage on these pitches than batters did (many of the SAME batters, remember) in 2014.
The strike zone grew dramatically in the early part of this decade, with nearly all of the growth in the actual, as-called-by-umpires zone coming through expansion downward, below the batters’ knees. This helped all pitchers, but two kinds in particular: those with great command of sinkers and low pitches, and those with catchers who could make low pitches more likely to be called strikes. Felix was obviously a great example of the former, while anyone who pitched to Jonathan Lucroy fit the latter category. Scoring dropped, as pitchers got ahead of more hitters – hitters who weren’t used to seeing those pitches called strikes. And pitch framing took off, as the Lucroys of the world made throwing down more profitable. Pitchers responded by following the money, and changed where they put their fastballs:
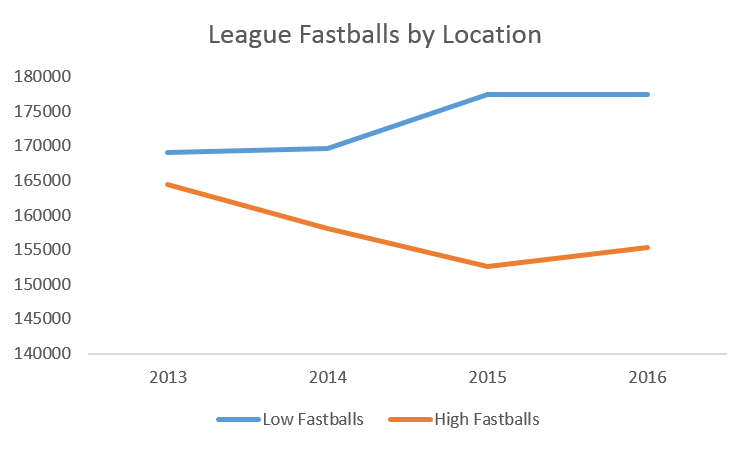
Now we’re seeing the counter-adjustments. The strike zone’s expansion slowed and then, ever so slightly, reversed. Hitters like Josh Donaldson and others learned to elevate low fastballs, and now hit low fastballs for power. The league as a whole first changed in a direction that seemed tailor-made for Felix to take advantage of, and he responded with two of his best seasons. The league as a whole has now changed in ways that seem perfectly designed to hurt Felix, and they’ve done so. Whereas Felix used to make his living on low fastballs, his advantage is essentially gone now.
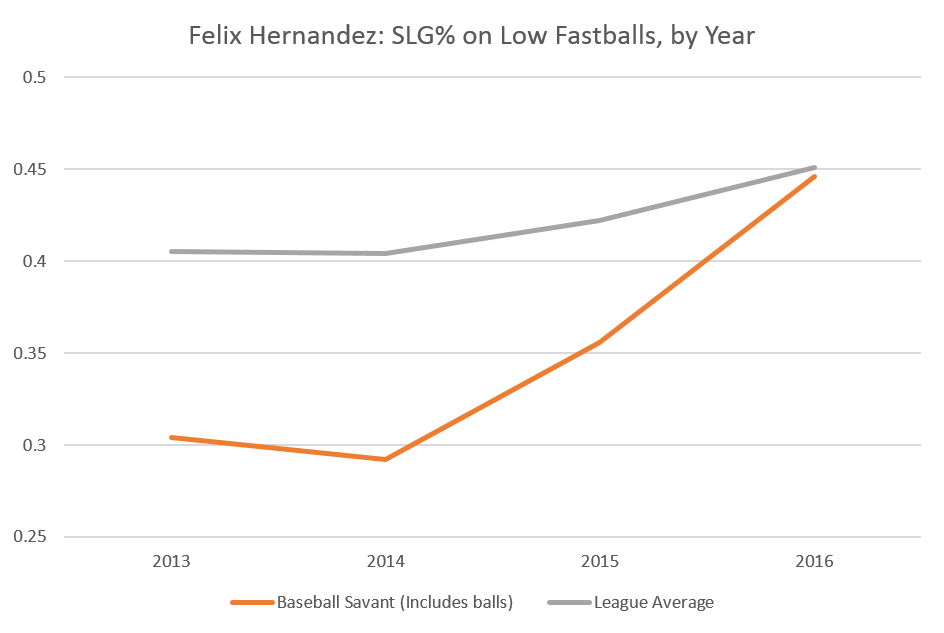
Felix is now league average when he throws a low FB, which is terrible, because almost by definition, any elevated fastball from Felix is a mistake. These data come from BaseballSavant.com, but the change is even starker if you focus on the bottom third of the zone in Brooks Baseball’s charts. Excluding the out-of-zone contact and focusing just on low strikes, they show Felix’s SLG%-against on fastballs as going from .448 in 2013+2014 to .661 in 2015+2016.
Felix needs to change. Here’s a chart of his vertical pitch locations throughout his career. 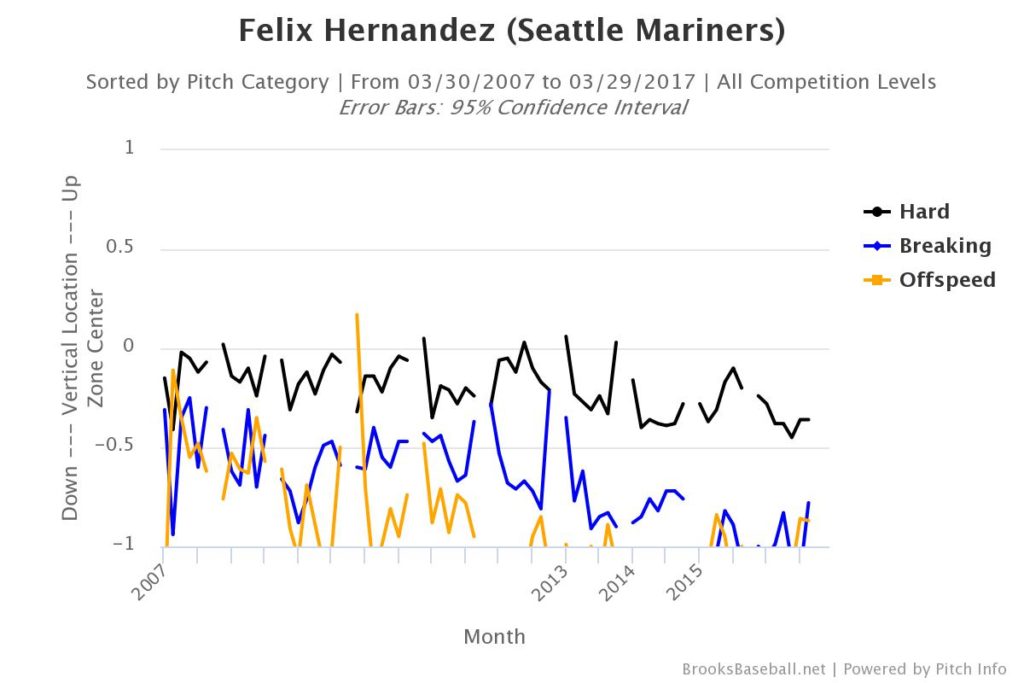 As Felix has lost velocity, he’s increasingly targeted the bottom of the zone (below the midpoint of the zone). He could learn something by looking at what Justin Verlander’s done, as shown below. Verlander was struggling for a few years, and his return to form has coincided with what looks like an intentional move UP in the zone.
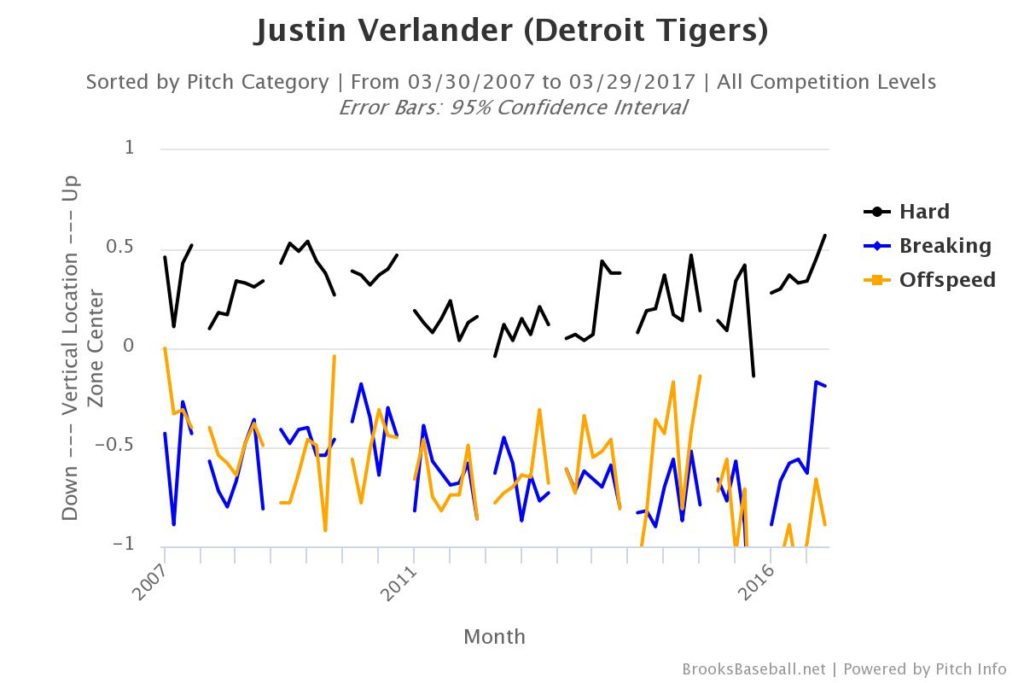
This may be uncomfortable, but the benefits are significant. A counter-adjustment is warranted, and ANY change from Felix seems like it’d make it harder for batters, especially those intra-divisional hitters who have seen him often. Felix’s command may not be what it once was, but that’s why targeting something other than the low strike might help: predictability plus so-so command is worse than unpredictable and so-so command.
So how’s it going? What meager data we have from the WBC and Spring training show that he’s already making some adjustments. His average FB height seems to be up this spring, especially in the WBC, where he used high FBs repeatedly to get weak contact, whiffs, and to set up his change/breaking balls. Unfortunately, he’s done this before – he’s thrown significantly higher FBs in the spring several times before, only to pitch differently once the regular season started. Felix doesn’t get enough credit for his pitching smarts, and it’s time for him to put them to use. More than FB velocity, more than command, Felix needs to rediscover the high FB. This isn’t a quick fix, as we saw with Brandon Drury’s HR on a high FB yesterday. They’re risk in changing a successful approach, and there may be bumps in the road as Felix learns how/when to go high. Still, he can’t rely on last year’s game plan, and using the entire zone offers his best chance of retaking his throne.
:Note: This post is similar to a lot of what Jake Mailhot had to say at LL a week or so ago, and both of us pointed to Jeff’s article at FG. Sorry to harp on this subject, but I wanted to talk about Felix’s adjustments specifically, and I wanted to get back to this topic after raising it (not just about FBs) midway through last year in one of my “what’s going on with Safeco?” posts.
With Vogelbach Demotion, M’s Roster Nearly Set
Didn’t see this one coming. For the past several months, the expectation has been that the M’s would give Dan Vogelbach the starting 1B job, either on his own or in a platoon with Danny Valencia. Today, though, the M’s optioned Vogelbach to Tacoma, handing the 1B job to Valencia and opening up a roster spot – presumably for a reliever.
Vogelbach has struggled in recent weeks, and leads the team in strikeouts with 19 in just 57 at-bats. For a team focused on controlling the strike zone, Vogelbach’s slump in precisely that area was going to draw attention. After opening the season with 8 Ks and 4 BBs in his first 26 ABs, he’s had 11 Ks and 3 BBs in his last 28. Overall, his K rate is 30%, not what the M’s wanted out of a bat-first position. Dipoto referenced the temporary demotions last year of James Paxton and Mike Zunino, with the thinking that he can get more work in for the Rainiers instead of playing sporadically as a bench bat in Seattle. That’s probably a good thing. He dominated the strike zone for Tacoma, but his SLG% of .422 probably wasn’t ideal for the position. Sure, the OBP was amazing, but I wonder if he made some adjustments looking to tap into more power and threw his swing (and process at the plate) out of whack a bit.
The final utility roster spot seems decided as well: Shawn O’Malley’s imminent appendectomy will require a few weeks of recovery time, so the job is essentially Taylor Motter’s by default. As with Vogelbach, I’d imagine we’ll see O’Malley at some point this season, but Motter will get the first crack at the job.
Cactus League Grinds On: M’s Host Giants
Given that a good chunk of their best players are currently in the WBC or flying back from it, it probably shouldn’t come as a big surprise that the M’s have frittered away some of their impressive strike zone stat advantage. They’re still pretty good, mind you, but they’re no longer among the top teams on either offense or defense. The pitching staff in particular has been unimpressive in recent days, thanks to some ugly lines put up by guys who are not realistically going to play for Seattle this year; the M’s now lead MLB in spring training HRs given up.
Hisashi Iwakuma will try to rebound from an ugly start in that 24-3 drubbing at the hands of the Brewers. I know it’s early, and that his game isn’t based on velocity, but Iwakuma’s averaged 86 MPH on his fastball in his first start of the spring, according to BrooksBaseball (so MLB would have it even slower). That was very early, and he got good outcomes, but after the Milwaukee unpleasantness, it might be worth watching. Iwakuma’s critical to this team, as one potential advantage people have ascribed to the M’s vis a vis the Astros is their rotation’s depth. If Iwakuma stumbles, or pitches more like a #4/5 starter, that advantage starts to look pretty shaky.
I’m not convinced that Collin McHugh is much more than a #3 or 4 at this point, and the Astros might need to ask a lot of their rookies Francis Martes/David Paulino, so I understand the point. But to me, the M’s rotation has as many question marks. A bounce-back season from Iwakuma would answer a big one, and a stretch of good health from James Paxton would answer another. The pieces are there for the M’s to have a better run prevention unit than the Astros, but a lot needs to go right. The M’s depth looks better today than it did a month ago thanks to strong springs from Andrew Moore and Max Povse, but the Astros still have secret weapon Chris Devenski, who had one of the best years for a swingman in recent memory, behind their starting 5.
Today against the Giants, the depleted M’s (day game after a day/night split squad day yesterday) have several back-ups starting and ready to come on later. Steve Baron starts at C, and ex-Indy Leaguer/ex-position-player-pitcher-hybrid Micah Owings’ may make an appearance out of the pen.
1: Martin, CF
2: Motter, 2B
3: Seager, 3B
4: Valencia, DH
5: Vogelbach, 1B
6: Heredia, LF
7: Gamel, RF
8: Smith, SS
9: Baron, C
Statcast’s New Defensive Metrics and Seattle’s Glove-First Outfield
I don’t want to write about yesterday’s Cactus League debacle any more than you want to read about it, and I’m loathe to look at more spring stats to see if the M’s early lead in K:BB ratio’s been frittered away the past few days. So instead, let’s look at one of the biggest stories of the offseason: the M’s remade outfield defense. You may have seen this Eno Sarris article at Fangraphs that says the 2017 M’s may be the first since the 2003 M’s/2013 Indians to field three true-talent CFs at the same time. It’s great, even if it does include video of that awful Mike Cameron injury. Importantly, it includes some quotes from Jerry Dipoto about how important defense was to their offseason plan, and how it complements the kind of pitchers they targeted – guys like extreme fly-baller Drew Smyly. Fortuitously, MLB’s Statcast group just released brand new data on outfield defense, breaking plays into 5 (with an implied 6th) buckets ranging from “nearly impossible to catch” to “nearly impossible to miss.” These new measures might help us get a handle on what the M’s baseline level of fielding was in 2016, and whether or not there’s anything about Safeco Field that will make the job easier.
The new statcast data includes 5 buckets, each given 1-5 stars. The 5 star buckets are converted into outs less than 10% of the time, and 1 stars are converted into outs about 90-95% of the time. Jeff’s got a great post on the new Statcast data today at Fangraphs, and he’s helpfully calculated the average conversion rate for the Statcast era, or 2015+2016. With that, we can compare each player’s catches to what we think a league average OF would make, given the same opportunities. I used his averages and calculated plays made above average for each player in 2015 and 2016, and then I looked at how their chances were distributed. That is, some players (Jackie Bradley, Jr.) saw proportionally more extremely difficult opportunities, while others (Kevin Kiermaier) saw fewer. The plays on the Statcast leaderboards apparently don’t include the absolutely never missed, can of corn, 100% probability balls. At least, that’s my guess just from noting that the sum of each players chances across all 5 buckets totals a fraction of their overall chances/putouts as reported elsewhere. If true, that means that the plays that really separate defenders are in a few not-terribly-large buckets in the ranges where catches are made 25-50% of the time or so. Given THAT, I’m pretty impressed with how reliable these numbers look. Kiermaier, Lorenzo Cain, Ender Inciarte, etc. look great both years despite varying playing time, opportunities, etc.
Let’s take a Mariner-centric view of this, and attempt to answer a few questions. First, how good was the M’s defense last year, and second, how much better was it than 2015’s? Third, does anything stand out about the distribution of the M’s outfield opportunities? Finally, what would replacing Nori Aoki with Jarrod Dyson and Seth Smith with Mitch Haniger do in terms of additional plays made?
Jeff mentioned it in his piece, but one of the first big takeaways is that Leonys Martin looks quite good in the Statcast-based metrics – better than he did in UZR/DRS, where he graded out as a dead-on average CF last year. Martin made 11+ plays more than expected, a bit better than the 4 runs saved by UZR, and a far sight better than DRS’s 2 runs *below* average. That edges out Lorenzo Cain, who ranked 2nd in all of baseball in 2015. On the other hand, it essentially ties him with the 11 runs saved by the M’s 2015 CF, Austin Jackson (yes, Jackson split time that year with the Cubs, but the bulk of it was in Seattle). Seth Smith and Norichika Aoki both graded out a bit below average (probably not a shock to most M’s fans), while Nelson Cruz and Guillermo Heredia kind of cancelled each other out. Interestingly, the corner OF picture wasn’t all that different in 2015. It was worse, clearly, thanks to many more innings from Nelson Cruz, the Mark Trumbo experience, and Brad Miller’s disastrous trial in the OF. That said, Seth Smith graded out as a perfectly average OF, and he played more defensive innings than Cruz, and more than Trumbo and Miller combined.
One striking thing about the distribution of chances the M’s have handled is that nearly every M’s OF has faced slightly more “midrange” opportunities, and *every* M’s OF has faced fewer 5 star opportunities. I combined the middle three Statcast buckets into one group, and compared that to the hard/easy outliers. Across the league, about 23-24% of balls are in the 5 star bucket, and 32% are in the 1 star; this was remarkably consistent in both years. Combining the rest into one larger group, you’d expect players to get about 44-45% of their chances in this maybe/maybe not zone. In general, the M’s were higher than that, with the CFs (Martin in 2016 and Jackson in 2015) at 50% or so. A few of the corner OFs had fewer opportunities in this midrange zone, but in those cases, the extra chances went to the “easy” bucket, NOT to the hardest one. Seth Smith and Mark Trumbo had a lot more “easy” chances in 2015, so every M’s player season in the list faced fewer 5 star chances than we’d expect. I’m biased, of course, but I think that adds some credence to the hypothesis in my last post on OF defense that Safeco gives OFs a higher defensive floor than most parks.
That parks could change the distribution of fly balls makes some sense, as Colorado’s massive OF would mean balls hit a hundred feet from an OF might still be in play instead of in the 8th row of seats. Boston’s huge CF might account for why, say, Jackie Bradley and Mookie Betts had so many MORE 5 star opportunities (but it wouldn’t explain why they didn’t in 2015). That said, I’m pleased to see that getting a bunch of 5 star opportunities isn’t correlated with high defensive rankings. There are many ways to succeed here, as Adam Eaton got a lot more 5 star and 1 star plays and graded out brilliantly, while Kevin Kiermaier had the opposite distribution (lower on the tails, big in the middle) and did well, too.
It’s a tiny sample, but Mitch Haniger looks really good by Statcast, and it’ll probably come as no shock that Jarrod Dyson does, too. I think what we’ve seen here is that the M’s OF defense wasn’t the historically awful group that, say, DRS thought they were in 2015 and they weren’t bad in 2016, either. That said, there’s still plenty of room for improvement, and in Dyson and Haniger, the M’s acquired two players who will almost certainly get to more balls in 2017. Quantifying it is difficult, but 20 additional plays seems like a very conservative number to start with, assuming 5 plays below average for Aoki/Smith and 15 above for Dyson/Haniger. Decent positioning should help the M’s get to more of the tougher “midrange” chances, and the post-2012 dimensions means the M’s don’t have to worry about as many of the nearly-impossible ones. To get the biggest bang for their trading buck, the M’s would presumably hope for more opportunities overall, and that brings us back to the weird HR effects Safeco Field saw in 2016. Regression *there* would produce big savings in runs allowed, as you’d take HRs off the board (duh) and turn more of the resulting balls in play into outs.
Other random items that come to mind after staring at a spreadsheet:
1: I left the minimum balls in play threshold at 50, the same as the default setting at Baseballsavant.com. You can play around with it, but what it does is exclude some defensive experiments that might pull down the overall average. That means that the group who gets rated was the group entrusted with fielding a few games, and not just a few innings in an emergency. Thus, the league-wide plays above expected level isn’t zero – it’s quite a bit higher. Interestingly, that was much less of an issue in 2016 than 2015, when the cutoff meant the league appeared to make 200+ plays more than expected.
2: Jeff also mentioned this (damn him), but the Angels OF defense takes a hit when comparing these new Statcast metrics to UZR/DRS. Mike Trout goes to just below average, while Kole Kalhoun goes from unheralded defensive star to solidly below average in both years. No point to this, just some Statcast schadenfreude.
3: One hypothesis I’ve had is that fly ball staffs (and the M’s have been one under Jerry Dipoto) might produce easier balls in play. That is, that Marco Estrada, for example, gives up a lot of home runs (which aren’t in play) on well-struck balls, but then a lot of pop-ups on poorly-struck balls, producing a consistently-low BABIP. These buckets exclude pop-ups, I think, so there’s no real way to tell. The M’s don’t look like they saw MORE “easy” chances, but then, we’re not seeing the easiest of the easy. It might help to compare the total opportunities in Statcast versus total chances in BBREF and see what proportion of total chances are ranked in Statcast. My assumption would be that a higher percentage of Statcasted-balls would mean a more difficult group of balls in play. Someone (not me) should do that.
4: It’s really interesting to see how bad fielders drop off precipitously around 2-3 stars. Matt Kemp can’t make any plays in the 3-4 range, and neither can Trumbo or Cruz. Like you’d expect, they’re perfectly capable of making the easiest plays, and they’re not penalized too harshly for not making highlight-reel catches. But their plays made just fall off a cliff once the expected catch rate gets to 50% or so.
Control the ‘Zona
I understand the limited utility of spring training stats. Small samples, lots of plate appearances by A-ball prospects no one’s heard of, different environment, unbalanced schedule, etc. I get it, and you can add to that the fact that I’m using only half of the cactus league “season” for this. This may mean nothing, but I thought I’d check in on how well the M’s have managed to “control the zone” given how central that message seems to be in their player development strategy.
A further objection might be: “Spring Training is a biased sample of the organization as a whole, because the team might only let certain prospects into games.” This is valid, of course, and a decent reason why the stats might not represent the org’s “true talent” for, say, K:BB ratio, but it’s also the mechanism by which the organization reinforces the importance they place on certain skills.
I grabbed some batting/pitching team stats from MLB.com and calculated walk rates, K rates and ratios for batting and pitching. The M’s currently lead the league in OPS/Average etc., but a key to their success has been a very high ratio of walks to strikeouts. Their walk rate of 10.3% ranks 7th, while their K rate is 3rd lowest – this produces a K:BB ratio of 0.62, a ways behind the Angels’ leading mark of 0.76, but 2nd in baseball. The M’s z scores (standard deviations from the league mean) are about 1.5 for each stat: walk rate, K rate and ratio.
How about pitching? The M’s as a team have produced a league-average K rate, but they’ve been remarkably stingy with walks; their BB rate is over 2 standard deviations from the league average of 8.9%. This drives a K:BB ratio* of 3.59, 2nd behind only Tampa’s 3.63. The Rays BB rate is solid, but their team K rate drives their ratio, as their 25%+ rate easily leads the league, while the M’s have the 2nd lowest walk rate, just a fraction behind Baltimore’s 5.50% mark.
The M’s thus rank 2nd in both hitting and pitching walk/K ratios, which is pretty remarkable. The Angels were #1 in batting, but tumble to 25th on the mound. The Rays are even worse, ranking *29th* on offense. It’s kind of a meaningless calculation, but if you sum the batting/pitching ranks for K:BB (and BB:K), the M’s mark of 4 is the only one in single digits. Baltimore and Pittsburgh are tied for 2nd at 13. So what does this mean? That the M’s are stacking the deck by giving innings to command/control prospects like Andrew Moore instead of high-risk/high-reward guys like…uh, Luiz Gohara? Sure, that’s a huge factor. But it’s a sign that the M’s development overhaul seems to be pretty effective. K:BB ratio is important, but it’s not the only thing, of course. It IS, however, something that seems both teachable (to an extent) and easy to identify and select for.
In case you’re wondering the M’s were pretty good on the pitching side of the ledger last year, posting a 2.95 K:BB ratio that was in the top half of the league, but weren’t spectacular offensively, with a ratio of just 0.42. Some of last year’s worst offenders have moved on (Franklin Gutierrez, for one), but a big part of the improvement has come from returning players like Leonys Martin and Nelson Cruz. Will any of this carry over? These stats are among the quickest to “stabilize,” meaning that they indicate something about true talent in smaller samples, but I’m not sure how much signal we have at this point. Still, it’s an encouraging sign, and something that’d give the club a bigger margin for error in the regular season.
____________________________________________________________________________
I was going to write this yesterday, and the M’s ratios took a hit thanks to the Cubs’ pitching staff, but well done by the M’s minor leaguers to come back and get a late win. Today’s game’s on TV, so tune in and watch the M’s attempt to maintain strict control of their zone. Or something.
M’s at Cincinnati Reds, 12:10pm
Chase de Jong vs. Brandon Finnegan
1: Dyson, LF
2: Motter, 2B
3: Haniger, RF
4: Valencia, 1B
5: Zunino, C
6: Ruiz, DH
7: Martin, CF
8: Smith, 3B
9: O’Malley, SS
SP: De Jong
* I flipped the ratios to get both on the “higher is better” scale.
Cactus League: Trial Separation
It is morning here on the west coast, and I bring you the glad tidings that Tyler O’Neill has already homered today. He did so off of Luis Severino (not some A-ball scrub), and he did so for Team Canada.
As you know, the WBC is underway, with Seoul and Tokyo hosting several games already,* and with other teams getting ready by playing MLB clubs in spring training. The M’s are losing quite a few players to the event, as we talked about the other day. Robinson Cano’s batting 2nd, Nelson Cruz 5th, and Jean Segura 7th for the Dominican against Pittsburgh today, for example. Edwin Diaz is in Puerto Rico’s bullpen as they face San Francisco, and Felix will be with Team Venezuela.
Drew Smyly will join Team USA later, but for now, he’s looked pretty sharp for Seattle. He’s coming off his worst year, and it’s nice to see his velocity already at or a bit higher than it was last April. He’s clearly working on his cutter, too – he threw more of them than he did his primary breaking ball, his weird non-curving curve. I’d kind of prefer he just ditched the pitch entirely, but I suppose improving it works, too.
Smyly’s kind of an anomaly in that so much of the contact against him comes as fly balls. Among all starting pitchers last year, no one had a higher average launch angle against than Smyly. No M’s starter is anywhere close to Smyly in that regard, but then, no Mariner starter is close to him in average exit velocity either. Smyly yielded the weakest contact – on average – of anyone the M’s might use as a starter this year (the highest? James Paxton, who actually had the *lowest* launch angle). Smyly is walking the tightrope by throwing rising fastballs up in the zone, and getting plenty of pop-ups and lazy fly balls (and whiffs, of course), but also yielding the occasional long ball. Again, a big part of the problem in recent years has been his secondary or tertiary pitches, which have been annihilated. This is not to say that he needs to try to get grounders with his cutter. Several relievers have made their living by yielding fly ball contact/avoiding grounders, even with breaking balls: ex-Mariner Shawn Kelley’s turned himself into a minor star with this approach. Steve Cishek, too, has a slider that batters get under pretty frequently, which may explain some of his volatility (a tiny change in break may make the difference between a texas leaguer and a long home run). Kenley Jansen generally only throws one pitch, but it’s all but impossible to hit on the ground. Smyly’s approach works for Justin Verlander, as well; the Tigers ace has cut his GB rate by almost 10 percentage points in the past 3-4 years, and recovered his old effectiveness at the same time.
Tonight, the non-WBC M’s take on Cleveland and Carlos Carrasco. Carrasco put together a solid year for Cleveland, but missed time with a fractured hand suffered just before the Indians’ playoff run. The righty’s late emergence as a frontline starter roughly 7-8 years after being tabbed a top prospect has been a great story, and he’s maintained his effectiveness now for 2.5-3 seasons. That said, last year saw his HR rise for the 2nd straight year, and lefties started to hit him a bit harder than before. Lefties had destroyed Carrasco early in his career, one of the major reasons he seemed destined to become a busted prospect. But a trip to the pen and some improved command made Carrasco deadly to righties and lefties alike. From 2014-2015, lefties hit just .205 off of him, with just 35 extra-base hits. Last season, though, lefties slugged 11 HRs and 28 XBHs on their way to a .441 SLG%. Something for Indians fans to watch for/worry about.
The game starts at 6:10pm, Seattle time, and will be televised on Root Sports.
1: Dyson, LF
2: Martin, CF
3: Seager, 3B
4: Valencia, DH
5: Vogelbach, 1B
6: Haniger, RF
7: Ruiz, C
8: Motter, SS
9: Freeman, 2B
SP: Iwakuma
* The story of the tournament thus far (the actual tournament, not the even-less-real-than-regular-spring-training games against MLB clubs) has been Team Israel, who won their first two games, including an upset of South Korea in Seoul. They feature ex-Rainier Ty Kelly, and another ex-Rainier, Andrew Lorraine, serves as pitching coach.
Cactus League Check-In (and another game, too)
The Cactus League “season” grinds on, as the M’s send Drew Smyly to the hill today as they host the Rangers. At this point, with the M’s not quite a month into their preparations and after 10 or so practice games, we’ve seen pretty much every pitcher the M’s will begin the regular season with. While no one’s throwing the way they will in July, pitchers are – even in early March – throwing much the same as they will come April. As Felix and Hisashi Iwakuma have lost ground on their fastball velocity, their spring training numbers picked up the decline early: Felix’s ST velocity has been within 1 MPH or so of his April velocity going back several years. Hisashi Iwakuma’s 90MPH velocity was the same in March of 2012 as it was when the season began; his velo spike in 2013 was already showing up in March of that year, and his 2016 decline was reflected in last year’s spring numbers. So while there are plenty of very real caveats to using tiny snippets of spring training pitch FX numbers, it’s not like they’re completely useless.
Felix Hernandez
Felix comes into 2017 in great shape after re-dedicating himself to offseason fitness and strength training. He was pretty clearly unhappy with his declining stuff, and to his credit, took it upon himself to regain a tick or two on his sinker and fastball. A year ago, Felix was throwing about 91 MPH during the spring, which is in line with what he’d do the rest of the way. Thus far in 2017, it looks like his velocity may have crept up slightly. He averaged 92 with his sinker the other day, and he touched 93 several times…something he didn’t do at all last spring. That’s not a huge improvement, but anything other than continued velocity decline would be pretty welcome news. It may not mean anything, but his change has not had an equivalent gain, meaning there’s a bit more separation between fastball and offspeed. Felix hasn’t really needed that separation, and it given the sample, it may be nothing, but it’s something to watch for as we wait for meaningful games to start.
Thyago Vieira
Vieira’s incredible velocity was the story of the Arizona Fall League, and the imposing Brazilian gets regular coverage in Ryan Divish’s twitter feed and game stories. He routinely exceeded 100 MPH in Arizona, and posted decent control numbers during the 2016 minor league season. That sounded like a great combination, and one that could catapult the 23 year old to the majors at some point this year. At this point, his average velocity’s down a tick or two from the Fall League, though his peak velocity shows he’s still more than capable of 100-101. The problem’s been his control, and Divish noted in his first appearance that he eased up on his fastball in order to find the zone. Vieira pitched again this weekend, and had even more trouble trying to locate his pitches. Just 12 of his 25 fastballs were strikes, with the majority of his misses clustering towards the right-handed batters box. Plenty of pitchers have command lapses in early March, so it’s not yet a huge red flag, but given the control issues that have plagued his tenure in the M’s system (at least until last year), it’s something to watch. On the plus side, it’s nice that Vieira can dial his fastball back and STILL sit in the upper 90s. (Kate Preusser has a great profile of him today at Fangraphs, incidentally.)
Chris Heston
I mentioned in the game preview before his first appearance that it’d be great to see him touching 90 instead of the 88 he was at in his first MLB action since TJ surgery last year. In that start, he was still firmly in the 88-89 range, but he looked much better over the weekend, touching 91 and averaging just under 90. Obviously, velocity’s not a huge part of Heston’s game, but here his velocity is more a measure of his overall arm strength. Heston was a decent big league starter before his injury, and while his upside isn’t that high, it’s not bad for a potential 5th-6th-7th starter. Given that the injury risk in the rotation is always high, and probably higher still for the M’s, depth like Heston is critical. If he can build on the velocity he showed the other day, he’s got a decent chance to add some value. It’s not all the way back to pre-injury levels yet, but at least the trend’s going in the right direction.
James Paxton
Ok, ok, when I said spring velocity numbers weren’t totally useless…that doesn’t apply to James Paxton. Perhaps no pitcher in recent memory’s had such a varied record in terms of his velocity. The fact that he’s had so many nagging injuries probably has something to do with it, but it’s not the only thing. In early March of 2013, he averaged 91 MPH on his fastball, before getting a September call-up that year on the strength of his 95-96 MPH heater. He sat about 95 the following spring, and bumped that up to 96 in April before a long, injury-necessitated layoff. His velo was fairly stable until April of 2015, when it briefly dipped a bit to just under 94, but he was back on track before another injury took several more months from him. Last spring, he was down noticeably, averaging 92 or so- he’d show flashes of 95 MPH velo, but wasn’t able to sustain it, and thus lost his bid for a rotation spot to Nate Karns and headed to Tacoma instead. You know what happened then – he touched 100 in his first game back for Seattle and averaged 98, and while his velocity dimmed a bit towards the end of the year, he sustained the highest velocity of his career for half a season. Given all of that, I was very interested to see where he was this spring, even if we’ve just demonstrated that Paxton’s spring velo bears surprisingly little relationship to his regular season numbers. This Saturday, Paxton averaged 95, with his fastest pitch registering 97. That’s clearly down from where he left off, but we’ll see if he improves over the course of the spring or if he again does something completely different during the season. I’ll admit that, despite its lack of predictive power, it would make me feel a lot more confident in the M’s rotation to see Paxton sitting 97 in a game this spring.
Ok, there’s still a game today, and maybe we’ll see how Drew Smyly’s velocity looks.
1: Dyson, CF
2: Haniger, RF
3: Seager, 3B
4: Valencia, 1B
5: Vogelbach, DH
6: Zunino, C
7: Heredia, LF
8: Motter, 2B
9: O’Malley, SS
SP: Smyly
Still More Cactuses: M’s at Rangers
Hisashi Iwakuma vs. Tyler Wagner, 12:10pm
Good to see Iwakuma take the mound, as he’s going to be critical to the M’s playoff chances this year. After an injury-plagued 2015 and his worst MLB season last year, Iwakuma’s kind of at a crossroads. If he bounces back to his career averages, he gives the M’s an excellent mid-rotation starter and allows the M’s starting pitching depth to be deployed to back up Yovani Gallardo or whoever gets hurt. If Iwakuma’s ineffective or hurt AND Gallardo struggles, the M’s are in trouble. He’ll turn 36 shortly and his X-rays looked scary enough that he’s had two contract offers rescinded, but it’s impossible not to root for the guy. A mild rebound – which is essentially what the projections systems have him down for – is a huge help: a slightly above-average starter who’s durable enough to soak up a lot of innings.
Texas starter Tyler Wagner’s bounced between the Brewers, D-Backs and now Rangers in his brief career. He moved from Milwaukee to Arizona alongside new M’s shortstop Jean Segura actually, in a package for Chase Anderson/Aaron Hill/SS prospect Isan Diaz a bit more than a year ago. If you’ve been reading the minor league recaps, you’ll recall I’ve actually mentioned Wagner a few times – which is strange for a low-round draft pick without much in the way of raw stuff. Still, Wagner opened enough eyes in AA in 2015 that he got a cup of coffee with the big club, and he was seen as polished enough to be a part of a big trade just before the 2016 system. Back in 2015, I called him a sinkerballer, but BrooksBaseball calls his fastball a four-seamer…albeit one that has a lot of sink. He throws a slurve at 79 that’s got a fair amount of spin, and he’s had some success with a straight change that doesn’t look like it should be effective, but has been thus far. An interesting pitch for him is a hard cutter – it’s thrown at 90mph, essentially as fast as his four-seam FB, which averages 90-91. The cutter has similar vertical movement, but half a foot or more less armside run. It looks and acts like a fastball, so Wagner uses it accordingly: in his very brief MLB career, he’s thrown about 35% four-seamers and 30% cutters. He’s not a big strikeout guy at all, and his minor league walk rates aren’t anything special, so if he’s going to succeed, it’s going to be by keeping the ball on the ground.
1: Dyson, CF
2: Segura, SS
3: Cano, 2B
4: Cruz, DH
5: Seager, 3B
6: Valencia, 1B
7: Haniger, RF
8: Gosewisch, C
9: Powell, LF
SP: Iwakuma
Should get a look at more of the NRI relievers the M’s picked up this offseason, like Christian Bergman and Ryan Weber, today.
Sounds like Andrew Moore and Chase de Jong will pitch in a split-squad game on Sunday vs. the Dodgers. Moore gets the start in that one, while Felix starts the other game. That one’s important because it’ll be the first M’s game to get televised. It’ll be on Root Sports.
Cactus League Game 6: Brewers at Mariners
Ariel Miranda vs. Matt Garza, 12:10pm
Lefty Ariel Miranda was sharp in the M’s first game of the spring, but the list of guys he’s competing with keeps growing. The arrival of Chase de Jong (who may play in a split squad game this weekend) means the M’s now have even more options for rotation depth. Of course, most of those options are right handed, so Miranda’s got an edge, but even that’s a double-edged sword. Given the M’s interest in having lefty options in the pen, Miranda might get more of a look as a swingman/lefty reliever.
The M’s face the suddenly intriguing Milwaukee Brewers, who’ve been remaking their team quickly and effectively over the past year under new GM David Stearns. Today they’ll face long-time right-handed dude bro Matt Garza, who’s struggled mightily over the past two seasons with the Brewers. At his peak, he was successful against righties and lefties alike, with a curve and slider that were equal-opportunity weapons. Ultimately, though, his success was predicated on fastball command, as his four-seam and sinker mix drove his production. In 2014, his sinker in particular was difficult to elevate, and he was great (when healthy). Since then, though, his fastball’s been hit harder, and his breaking balls have been less effective against…righties.
A slight downturn in results by various pitch types is normal for a pitcher who’s now 33 years old, and his fastball results still haven’t been THAT bad. Instead, what’s killed him recently is an absolutely abysmal strand rate. Even in 2014, was devilishly low at 66.6%, and it’s only dropped further since. He finished 2016 with a 63.3% mark, which ranked 139th out of 142 pitchers to throw 100 IP. Of the 132 pitchers who’ve thrown at least 300 IP since 2014, Garza’s 65.3% average ranks dead last.
1: Dyson, CF
2: Segura, SS
3: Vogelbach, 1B
4: Cruz, RF
5: Haniger, DH
6: Ruiz, C
7: Motter, 3B
8: O’Neill, LF
9: O’Malley, 2B
SP: Miranda
The M’s will soon see an exodus from training camp, as Jean Segura will join Robinson Cano and Nelson Cruz on the Dominican World Baseball Classic roster, while Tyler O’Neill will suit up for Team Canada and King Felix for Venezuela. In all, 12 players have some sort of commitment to the WBC, with Drew Smyly joining Team USA in the 2nd round. The complete list is here. Of the M’s top 10 projected players by WAR, 6 (Felix, Segura, Cano, Cruz, Smyly and Edwin Diaz) will play in the WBC.
The Brewers line up features ex-Mariner and ex-Korean League MVP Eric Thames, who’s trying to prove his utter destruction of the KBO wasn’t a fluke. His signing was a great, low-risk, potentially high-reward move by the Brewers. Today’s starters also include top prospects Lewis Brinson and Oswaldo Arcia, along with Brett Phillips. Phillips was a rising star in the Astros system before moving over with Josh Hader in the Carlos Gomez deal (man, did THAT work out for Milwaukee). He had a great pure hit tool, with K rates solidly under 20% up the chain for Houston, but starting striking out a ton as soon as he got to the Brewers. After a down year last year (ameliorated a bit by a great walk rate), he’s looking to prove he’s still a candidate for a promotion this year.
